GOP Has Made Gains in Party Preference Since the Summer

Written by Jeffrey Jones
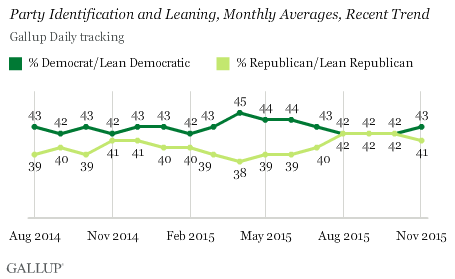
Americans’ party preferences are closely divided, with 43% identifying as Democrats or leaning Democratic and 41% identifying as Republicans or leaning Republican. The parties have been essentially tied since August, representing a shift from months prior when Democrats had the party affiliation advantage.
The results are based on Gallup Daily tracking interviews with approximately 15,000 Americans each month. Gallup asks Americans to say whether they identify politically as a Republican, an independent or a Democrat. More say they are independents (38%) than say they are either Democrats (30%) or Republicans (27%). All independents are then asked if they lean more toward the Republican or Democratic Party. Party “leaners” overwhelmingly vote for their preferred party, so the combined measure of party identifiers plus leaners gives a better sense of the relative strength of each party, especially because most election contests come down to a choice of a Republican or a Democratic candidate.
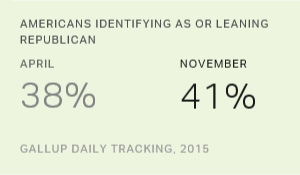
Democrats began the year with a slight edge in party affiliation, 43% to 40%. That gap expanded in April, to seven points (45% to 38%), when many of the presidential candidates announced their intentions to run. At that time, Hillary Clinton, the presumed Democratic front-runner, was easily the most popular candidate from either party in the field.
The Democratic advantage in party affiliation began to shrink in late spring, as Clinton became increasingly entangled in a scandal over her use of a private server to send and receive classified emails when she was secretary of state. The controversy took a toll on her image — by July, more Americans said they had an unfavorable than favorable opinion of Clinton.
While Clinton’s image was suffering, the Republican field received increased media attention. Businessman Donald Trump, in particular, attracted media coverage for a succession of brash remarks and controversial policy statements, particularly on immigration.
The Republican Party’s first presidential candidate debate, held in early August, earned record television ratings for a presidential primary debate. By the end of the month, an equal percentage of Americans identified and leaned Republican as identified or leaned Democratic. Since August, the Republican Party has held four presidential candidate debates, compared with two for the Democrats, keeping the GOP in the spotlight.

Party preferences had been tied at 42% from August through October — the high for Republicans and leaners in Gallup’s seven-year party identification trend. Democrats have regained a slight edge in November, 43% to 41%.
Implications
With just one month remaining until the start of the next presidential election year, the two parties are highly competitive in terms of the percentage of Americans aligned with each.
While some observers may have predicted that the controversial statements and positions of leading GOP candidates such as Trump and Ben Carson could hurt the party’s image, these results show that on the contrary, the Republican Party’s standing relative to the Democratic Party has improved since the spring.
Given usual Republican advantages in election turnout, having party preferences closely divided among national adults would be a sign of a potentially strong Republican year. But as the 2015 trend shows, party preferences can shift over the course of a year, and one party can gain, or lose, an advantage fairly quickly.
These data are available in Gallup Analytics.
Survey Methods
Results for this Gallup poll are based on telephone interviews conducted Nov. 1-30, 2015, on the Gallup U.S. Daily survey, with a random sample of 14,212 adults, aged 18 and older, living in all 50 U.S. states and the District of Columbia. For results based on the total sample of national adults, the margin of sampling error is ±1 percentage point at the 95% confidence level. All reported margins of sampling error include computed design effects for weighting.
Each sample of national adults includes a minimum quota of 60% cellphone respondents and 40% landline respondents, with additional minimum quotas by time zone within region. Landline and cellular telephone numbers are selected using random-digit-dial methods.
This article was originally published at Gallup.com.


