Red States Outnumber Blue for First Time in Gallup Tracking

Written by Jeffrey M. Jones
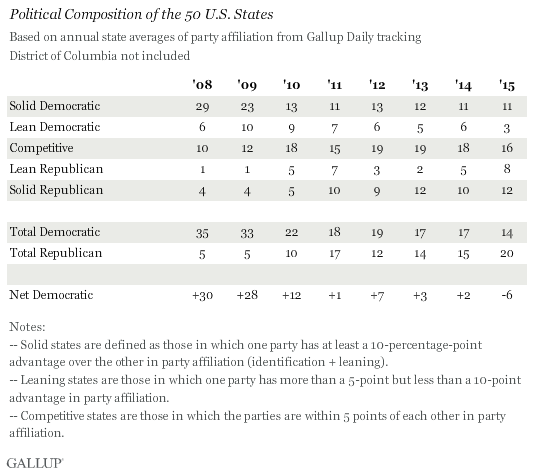
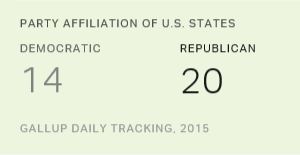
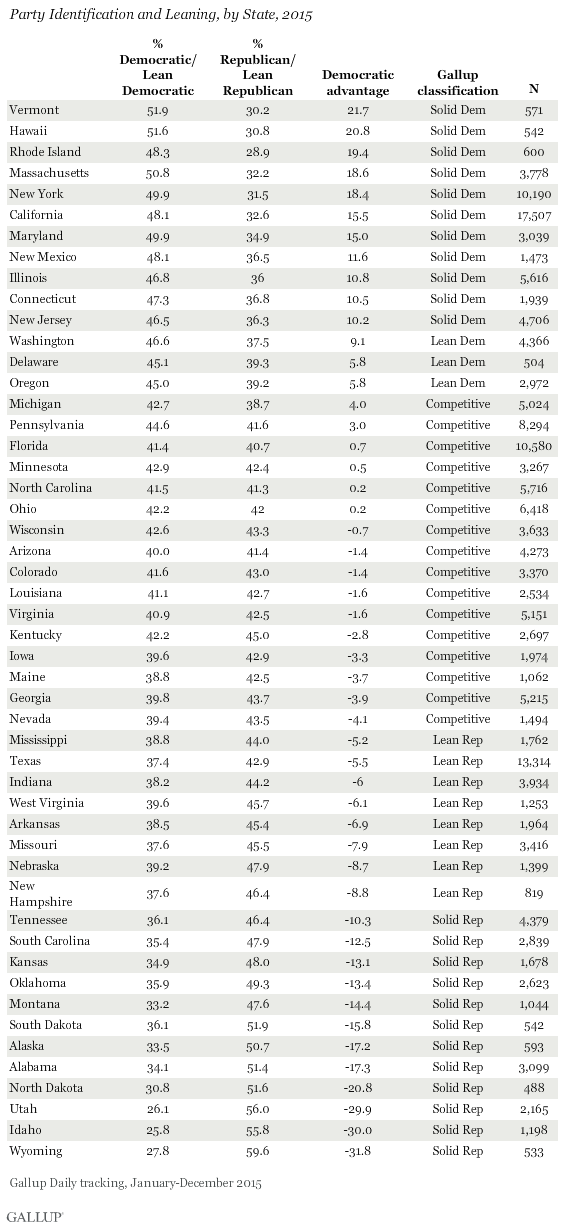
Gallup’s analysis of political party affiliation at the state level in 2015 finds that 20 states are solidly Republican or leaning Republican, compared with 14 solidly Democratic or leaning Democratic states. The remaining 16 are competitive. This is the first time in Gallup’s eight years of tracking partisanship by state that there have been more Republican than Democratic states. It also marks a dramatic shift from 2008, when Democratic strength nationally was its greatest in recent decades.
Importantly, even though Republicans claim a greater number of states, Democrats continue to hold an edge nationally in partisanship. In 2015 Gallup Daily tracking data, 43% of all U.S. adults identified as Democrats or leaned Democratic, compared with 40% identifying as Republican or leaning Republican. That is largely because many of the most populous states, including California, New York and Illinois, are Democratically aligned.
Gallup asks Americans each day as part of its Daily tracking survey whether they identify politically as a Democrat, a Republican or an independent. Independents are then probed as to whether they lean toward the Democratic or Republican Party. Combining the percentage of party identifiers and leaners gives a sense of the relative strength of each party in a given state, particularly because the percentage of political independents varies widely from state to state and can be high in states in which one party dominates electoral outcomes. The estimates are based on Gallup Daily tracking interviewing throughout 2015 and include no fewer than 488 residents in any state, with most state samples greater than 1,000.
Gallup considers states to be solidly favoring one party when they have a greater-than 10-percentage-point advantage over the other in party affiliation among the state’s adult population. “Leaning” states are those in which one party has an advantage of more than five points but less than 10 points. Competitive states show the parties within five points of each other.
In 2008, Democrats enjoyed a better-than 10-point advantage in party affiliation nationwide, as President George W. Bush suffered through low job approval ratings as a result of the recession and the ongoing war in Iraq. That year, Gallup classified a total of 35 states as solidly Democratic or Democratic leaning, compared with only five solidly or leaning Republican states.
In the last several years, excluding 2012 when President Barack Obama won re-election, there has been a roughly equal number of Democratic and Republican states. But that changed last year, when many more states’ political leanings moved in a Republican rather than a Democratic direction, giving Republicans a lead in more states than Democrats.
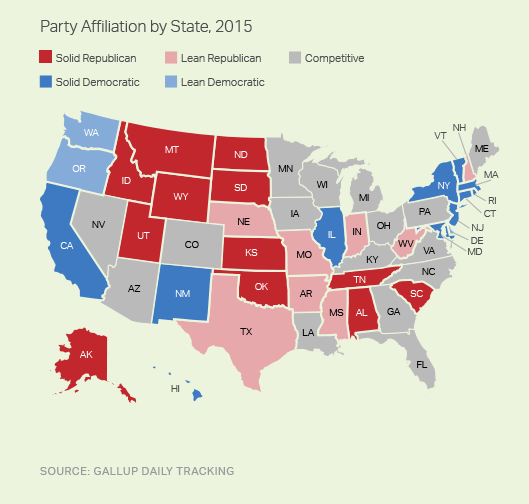
In all, 13 states’ political classifications changed between 2014 and 2015, with 11 of these shifting in a more Republican direction. The Democrats lost three states — Maine, Pennsylvania and Michigan — each of which moved from Democratic-leaning to competitive. Meanwhile, Republicans gained five states — New Hampshire, West Virginia, Missouri, South Carolina and Texas — all moving from competitive to leaning or solidly Republican. Additionally, Alaska and Oklahoma shifted from leaning Republican to being solidly Republican, and Delaware from being solidly Democratic to leaning Democratic.
Nebraska and New Mexico are the two states that moved in a more Democratic direction, though Nebraska remains in the Republican column, shifting from solidly Republican to leaning Republican. New Mexico moved from a leaning Democratic state to a solid one.
The following map displays the political classification of each state based on 2015 data. The full party results for each state appear at the end of the article.
Wyoming Most Republican State; Vermont and Hawaii Most Democratic
The Republican Party had its biggest advantage in state party affiliation in Wyoming in 2015 — 60% of Wyoming adults identified as Republican or leaned Republican, while 28% identified as Democrats or leaned Democratic — a 32-point gap. The GOP advantage was nearly as large in Idaho and Utah, at roughly 30 points each. Vermont and Hawaii were the most Democratic states, with advantages in favor of the Democratic Party in excess of 20 points.
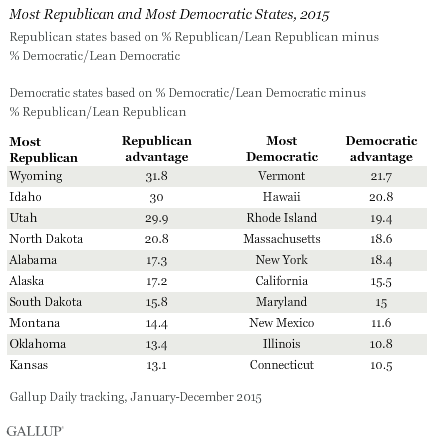
The most Republican and most Democratic states have been fairly consistent over time. Wyoming, Utah, Idaho and Kansas have been among the 10 most Republican states in each of the last eight years, and Montana, Alaska, Alabama, Nebraska and North Dakota have appeared in the top 10 in seven of the eight years. There is even greater consistency among Democratic states — all but two of the 10 most Democratic states in 2015 (New Mexico and Connecticut) have ranked in the top 10 in each of the last eight years, with Connecticut appearing seven times. New Mexico ranked among the top 10 states for the first time in 2015, with Delaware falling out of the top 10.
Ohio, North Carolina, Minnesota, Wisconsin and Florida are the most evenly balanced states politically, with less than one point separating Democratic and Republican Party preferences in those states. These states have been among the most highly contested “swing states” in recent presidential elections.
Alabama, Idaho Most Conservative States
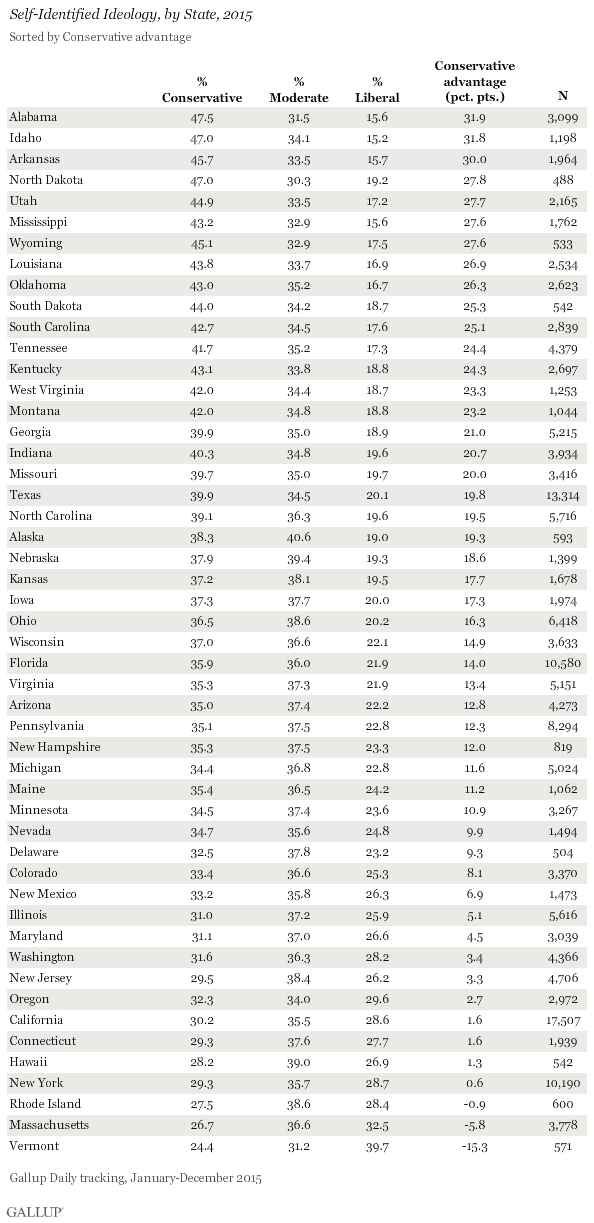
In addition to assessing party leanings, Gallup asks Americans whether they identify politically as liberal, moderate or conservative. Nationally, many more Americans say they are conservative than liberal, and consequently, conservatives outnumber liberals in all but three states — Vermont, Massachusetts and Rhode Island. The full data on ideology by state appear at the end of the article.
Partisanship and ideology are highly correlated. As a result, there is usually much overlap between the most conservative and most Republican states and, alternatively, between the most liberal and most Democratic states. Seven of the 10 most Republican states also rank among the most conservative, although Alabama, the fifth-most Republican state, ties Idaho as the most conservative. Vermont ranks as the most liberal state by a wide margin over second-place Massachusetts.
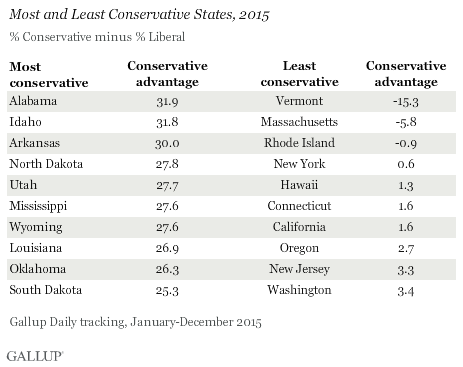
States that rank among the most conservative but not the most Republican include Arkansas, Mississippi and Louisiana, three Southern states that recently have voted Republican but were strongly Democratic states decades ago. Oregon, New Jersey and Washington rank among the least conservative states, but not among the most Democratic. However, those three states rank just outside the 10 most Democratic.
Implications
Monday’s voting in the Iowa caucuses marked the beginning of voting in the 2016 presidential election campaign. The ultimate winner will be determined according to electoral votes won, based on each state’s popular vote on Election Day this November. Presidential campaign strategists spend a lot of time developing their campaign plan and allocating resources based on which states’ outcomes are uncertain to determine where campaigning can make the biggest difference.
The partisanship of the state population is a starting point in determining a state’s likely vote, and there are more states in the Republican column heading into 2016 — a positive sign for the GOP. But because electoral votes are based on state population, the size of the state matters as much as the number of states each party holds. The 20 states that Gallup classifies as solidly Republican or leaning Republican account for 152 electoral votes, less than the 187 accounted for by the 14 solidly or leaning Democratic states plus the heavily Democratic District of Columbia.
But the election will not be merely a reflection of party preferences among adults in each state. If party preferences led directly to vote outcomes, Democrats would surely have won most presidential elections in the past, given their historical advantage in party preferences nationally.
Turnout is another key factor in determining the outcome, and it will especially be key in the 16 competitive states, which together account for 199 electoral votes. Republicans typically have an advantage in voter turnout in elections, and they will need to at least match Democratic turnout in competitive states in which they have a slight party advantage among all adults, such as Georgia, Virginia and Arizona. And the GOP will likely need to exceed Democratic turnout to win some of the larger, most politically balanced states like Florida, Ohio and North Carolina.
These data are available in Gallup Analytics.
Survey Methods
Results for this Gallup poll are based on telephone interviews conducted Jan. 1-Dec. 31, 2015, on the Gallup U.S. Daily survey, with a random sample of 177,991 adults, aged 18 and older, living in all 50 U.S. states and the District of Columbia. For results based on the total sample of national adults, the margin of sampling error is ±1 percentage point at the 95% confidence level.
Margins of error for individual states are no greater than ±6 percentage points and are ±3 percentage points in most states. All reported margins of sampling error include computed design effects for weighting.
Each sample of national adults includes a minimum quota of 60% cellphone respondents and 40% landline respondents, with additional minimum quotas by time zone within region. Landline and cellular telephone numbers are selected using random-digit-dial methods.
Learn more about how the Gallup U.S. Daily works.
Originally published at Gallup.com


